Take a Look at Climate Change In Your Backyard
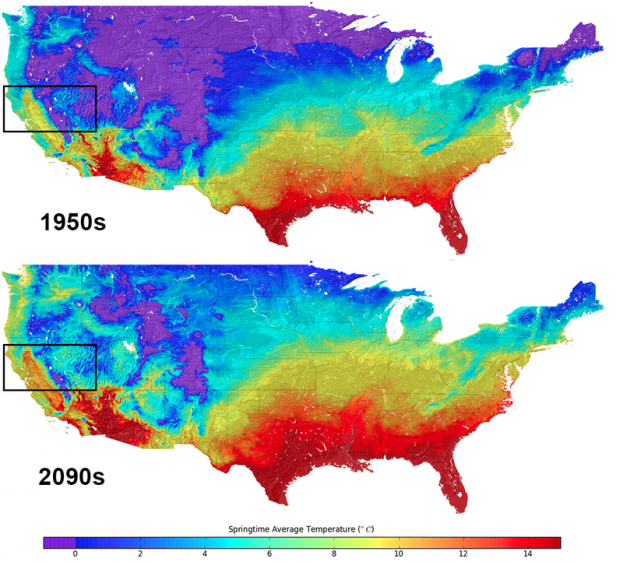
Image by NASA
NASA data contrasts average Spring temperatures for the 1950s and 2090s.
There’s no shortage of maps or data sets that show the long-term climatic effects of rising temperatures. But what about a map showing the temperature of your block in 2087?
You could find that in newly released temperature projections from NASA. Using information from historical measurements, local geography, and greenhouse gas statistics, the maps derived from the data display the most localized climate change picture to date.
Up to this point, the smallest scale for a climate change model has been 100 kilometers. But NASA’s new data zooms in to project changes at a much higher resolution. The result is a data set that localizes climate change to the scale of 800 meters, around the size of a neighborhood.
NASA (in conjunction with the Climate Analytics Group and California State University, Monterey Bay) produced this data by aggregating the results of models with larger scales.
They then combined those models with two other key components: long-term climate scenarios that accounted for greenhouse gas emissions, and the effects of local topography on temperature and precipitation patterns.
To make these calculations 800 meters at a time isn’t simple. So NASA used a supercomputer in order to crunch trillions of formluas in a second.
The data spans into the 2090s, when it will evidently be significantly hotter. The maps on NASA’s web site contrast the average spring temperature in the 1950s with the same measurement for the 2090s.
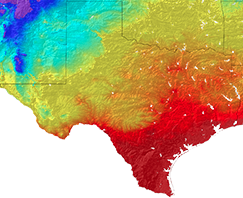
Image by NASA
Closer view of Texas' average spring temperature in the 1950s.
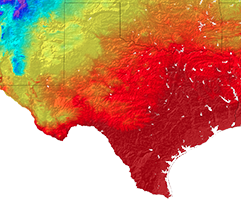
Image by NASA
Closer view of Texas' projected Spring temperature in the 2090s.
The outlook for Texas isn’t particularly promising. Although it is already one of the country’s hottest states, the maps show Texas increasing in average temperature by as much as three to four degrees Celsius in some places. The most drastic rise in temperature appears to be in West Texas to the South of Midland and Odessa.
Although it’s difficult to project what life will be like a generation from now, it’s likely that such a shift would cause problems for Texas’ coast. Among other complications, rising sea levels could displace coastal residents and disrupt industry in the region. There would also be an increased strain on Texas’ grid, as air conditioners would have to work harder to keep buildings cool.
Since the data is so localized, officials like city managers can use it to more effectively plan for climate change. Likewise, biologists, engineers, and others could use the data to build models for natural resources and local ecosystems.