Climate Change Clouds Future of El Niño Forecasting
In Central Texas, where water reservoirs sit at under 40 percent capacity, all eyes are on watch for El Niño, a global weather phenomenon that generally brings generous rain to the area. The National Weather Service predicts an 80 percent chance of a weak to moderate El Niño this fall, dampening hopes for a season of strong rains to alleviate drought across much of the southwest US.
But some scientists have warned that El Niño, itself poorly understood, cannot be well forecast amidst the effects of man-made climate change. As the global climate changes in reaction to increased manmade carbon emissions, forecasting global weather patterns can be difficult.
National Oceanic and Atmospheric Association / National Climate Data Center
This map shows a very warm year with most measured temperatures well above average.
In June, worldwide sea surface temperatures were higher than the 20th Century average by a greater margin than ever before. On land and sea, the month was the hottest June ever recorded, according to the most recent monthly climate analysis by the National Oceanic and Atmospheric Administration (NOAA).
Predicting global weather year to year becomes increasingly tricky as the basic climate gradually changes. Some researchers say El Niño will come more often in the future. Others say it will be less frequent and more intense.
According to the NOAA report, global temperatures have been above average for 352 consecutive months – every month since February 1985. Measurements highlight a global warming trend.

National Oceanic and Atmospheric Administration
This graph shows average global year-to-date temperatures fro every year since 1880.The crimson lines represent years 2013, 2010, 2005, 2003 and 1998; the green line is 2014.
“Nine of the ten warmest Junes on record have occurred during the 21st century, including each of the past five years. June 2014 also marks the second consecutive month with record high global temperatures. With the exception of February (21st warmest), every month to date in 2014 has ranked among the four warmest for its respective month,” said the report.
El Niño occurs when patterns in Pacific water currents change. Warm water gathered around the Southeast Asian coast begins to flow eastward until South America exchanging the climates of generally wet Southeast Asia and the dry western desert of South America. Unusually warm waters alter wind patterns, warming air and creating convection currents that can affect the entire globe. Many global and local effects of El Niño have been repeatedly observed since 1950 but still cannot be explained.
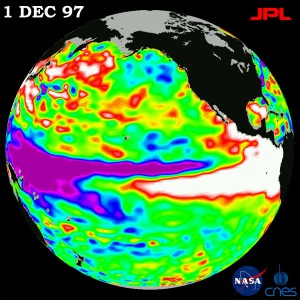
NASA / California Institute of Technology
This satellite image shows ocean topography, a good indicator of ocean temperature, during the 1997098 El Niño. The weather phenomenon is characterized by warm water in the Eastern Pacific and cool water in the West.
Even in Texas there is no consensus about El Niño’s effects and forecasters have predicted both above and below-average rain to accompany the phenomenon.
If El Niño comes and it brings extra rains to Texas, they won’t likely come until September.