Charting Florida’s Progress on ‘The Nation’s Report Card’

John O'Connor / StateImpact Florida
This chart compares Florida 4th and 8th grade scores on the NAEP against the national average.
Earlier today we reported that Florida student scores on the National Assessment of Educational Progress — also known as “The Nation’s Report Card” — improved slightly from 2011 scores.
We’ve charted NAEP reports since 1990 to show you how Florida’s scores have changed over time, and how those scores compare to the national average.
We’ve broken out math and reading scores for all students, students who qualify for the school lunch program — a common proxy for poverty — and students with disabilities.

John O'Connor / StateImpact Florida
This chart compares Florida 4th and 8th grade scores on the NAEP reading test against the national average.
John O'Connor / StateImpact Florida
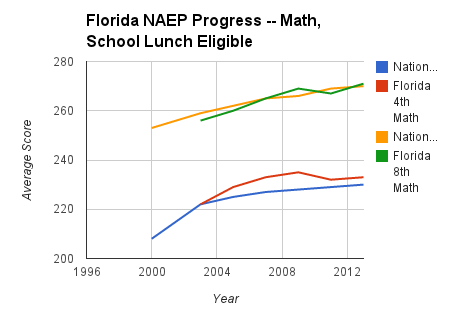
This chart compares Florida 4th and 8th grade scores for students who qualify for the free school lunch program -- a commonly-used proxy for poverty -- on the NAEP math test against the national average for those same students.

John O'Connor
This chart compares Florida 4th and 8th grade scores for students who qualify for the free school lunch program -- a commonly-used proxy for poverty -- on the NAEP reading test against the national average for those same students.

John O'Connor / StateImpact Florida
This chart compares Florida 4th and 8th grade scores for students with disabilities on the NAEP math test against the national average for those same students.

John O'Connor / StateImpact Florida
This chart compares Florida 4th and 8th grade scores for students with disabilities on the NAEP reading test against the national average for those same students.