How NH Counties Voted (Based On Economic Drivers)

Emmanuel Dunand / AFP/Getty Images
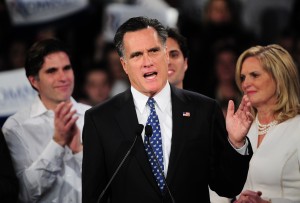
Romney won the NH primary by a healthy margin. We break down the county vote by economic drivers
This year, NHPR’s GOP primary coverage took on a strong national flavor, broadcasting to listeners all over the country. Among the network’s expanded audience were WNYC listeners in, well…NYC. And in the spirit of inter-station cooperation, the good folks at WNYC and Patchwork Nation used AP polling data to put together a county-by-county map of election results.
What interested StateImpact about this map is that it also classified each county according to its main economic drivers.
Before we get rolling, though, just one brief note about the map. To see statewide totals, move your cursor outside of New Hampshire. To get more details on how WNYC/Patchwork Nation determined the main economic driver of a county, just click on the colored icon in the map key. You’ll see a nifty pop-up including census data, poll numbers, and other info.
We’ve got a written break-down below the map.
Statewide Totals:
Before we break down what happened based on county economies, here’s the big picture. (We’ll be looking at the top three vote-getters statewide in our breakdowns.)
- Mitt Romney: 39 percent
- Ron Paul: 23 percent
- Jon Huntsman: 17 percent
- Newt Gingrich: 9 percent
- Rick Santorum: 9 percent
- Rick Perry: 1 percent
- Other: 1 percent
- Michele Bachmann: 0 percent
The Boom Town Vote:
There’s really only one county with the fast-growing “Boom Town” classification, Strafford County, making up 7 percent of the electorate. It pretty much followed the statewide breakdown, with Romney at 35 percent support. Paul garnered a formidable 25 percent support. And Huntsman’s votes earned him third place, with 16 percent support.The Campus And Careers Vote:
Grafton County, home of Dartmouth College, and Cheshire County, Keene State College’s home base, fall into this category. They represent 10 percent of the electorate, and tend to be college educated, secular, Democratic-leaning voters. They still broke for Romney…but not by as big a margin as Strafford County. His support came in at 31 percent. And Huntsman gave Paul more of a run for his money, garnering 21 percent of votes compared to Paul’s 25 percent.
The Service Worker Centers Vote:
Merrimack, Coos, and Sullivan County make up this economic category, and account for 17 percent of the primary electorate. This particular group of counties is characterized more by small and mid-sized towns which depend on service industries like hospitality, restaurants, and retail. “Median household income by county” also tends to be below average in these areas. Romney also won in these areas. Like the Campus and Careers counties, his support was below the state average, at 32 percent. Also like the previous category, Huntsman and Paul were closer than in the statewide totals. Paul earned 25 percent of the vote while Huntsman took 20 percent support.
The Monied ‘Burbs Vote:
It’s probably best not to take the suburbs reference in this category too seriously (especially since the larger Patchwork Nation project is looking at the demographics of the whole country, and its terminology wasn’t specifically designed to describe New Hampshire). With that in mind, what this category actually includes are areas that could be considered suburbs of Greater Boston–Rockingham County and Hillsborough County. And, it includes the amenities retirement meccas of Carroll and Belknap Counties. Fitting with Hillsborough and Rockingham’s status as New Hampshire’s major population centers, it’s not surprising that this voting block makes up 66 percent of the primary electorate. These are communities characterized by high levels of education and “median household income[s]…$15,000 above the national county average.” This is also the voting block that pushed up Romney’s statewide numbers, with 43 percent of the electorate offering their support. Paul came in second at 22 percent of the vote, while Huntsman trailed him at 15 percent (which is close to his statewide total).
Other Interesting Facts And Stats:
-

Andrew Burton / Getty Images
While Paul had a strong showing throughout NH, Coos County was most onboard with the "Ron Paul Revolution"
Romney got the highest percentage of the vote in Rockingham County, with 46 percent of voters supporting him.
- Romney’s worst performance was in Coos County, where he only snagged 28 percent of the vote.
- Second place finisher Ron Paul actually won Coos County outright, with 30 percent of the vote. Huntsman was a distant third there, with 15 percent support.
- Rick Santorum (who tied Newt Gingrich for fourth place with nine percent of the statewide vote) did better than Gingrich in Cheshire County and Strafford County.
- Newt Gingrich outperformed Rick Santorum in Coos, Grafton, Carroll, and Rockingham Counties.


