
How much do energy industry jobs pay? A look at the data
By Karin Kirk, Yale Climate Connections
This story originally appeared in Yale Climate Connections, and is republished here as part of Covering Climate Now, a global journalism collaboration strengthening coverage of the climate story.
As the U.S. economy recovers from the COVID-induced recession, the emphasis is shifting away from the simplified metric of the number of jobs, toward a focus on high-quality, high-paying jobs. As some service sectors languish with unfilled positions and shorthanded staffing, the energy industry pays premium wages. Energy workers are paid 34% more than the median U.S. wage, according to the 2020 U.S. Energy and Employment wage report.
Data show clean energy jobs pay slightly less than fossil-fuel jobs. But the data also show those clean energy jobs pay well, are plentiful, and are poised for major growth for the foreseeable future.![]()
That data is important in Pennsylvania, where there is tension between a robust fossil-fuel industry and the need to cut carbon emissions to mitigate the effects of climate change. Pennsylvania is on track for more intense heat waves and stronger storms in coming years, the Department of Environmental Protection says.
Scientists stress that rapid action is crucial to avoid the worst effects. Pa.’s most recent Climate Action Plan calls for an 80% reduction of greenhouse gas emissions by 2050, compared to 2005 levels.
Doing that will require hard choices by the nation’s fourth-largest carbon emitter: Pennsylvania must figure out how to cut emissions while planning for the future of people and communities that rely on the fossil fuel industry.
Comparing wages across energy sectors
Homer Simpson of “The Simpsons” made at least one good decision in his life – nuclear energy generation is the top breadwinner in the energy industry, according to wage data from the Bureau of Labor Statistics (BLS).
The Department of Labor agency data show parity between wages in the fossil fuel industry and renewables, with solar electricity generation edging out each of the fossil fuel sectors and wind being comparable to fossil fuels. That said, BLS does not track the wind and solar industries as closely as it does fossil fuels. For example, wind and solar jobs are tallied only within the utility sector and not in manufacturing wind and solar components. Nevertheless, the high wages in renewable electricity generation are a sign that top-dollar energy jobs will be part of the transition toward cleaner energy sources.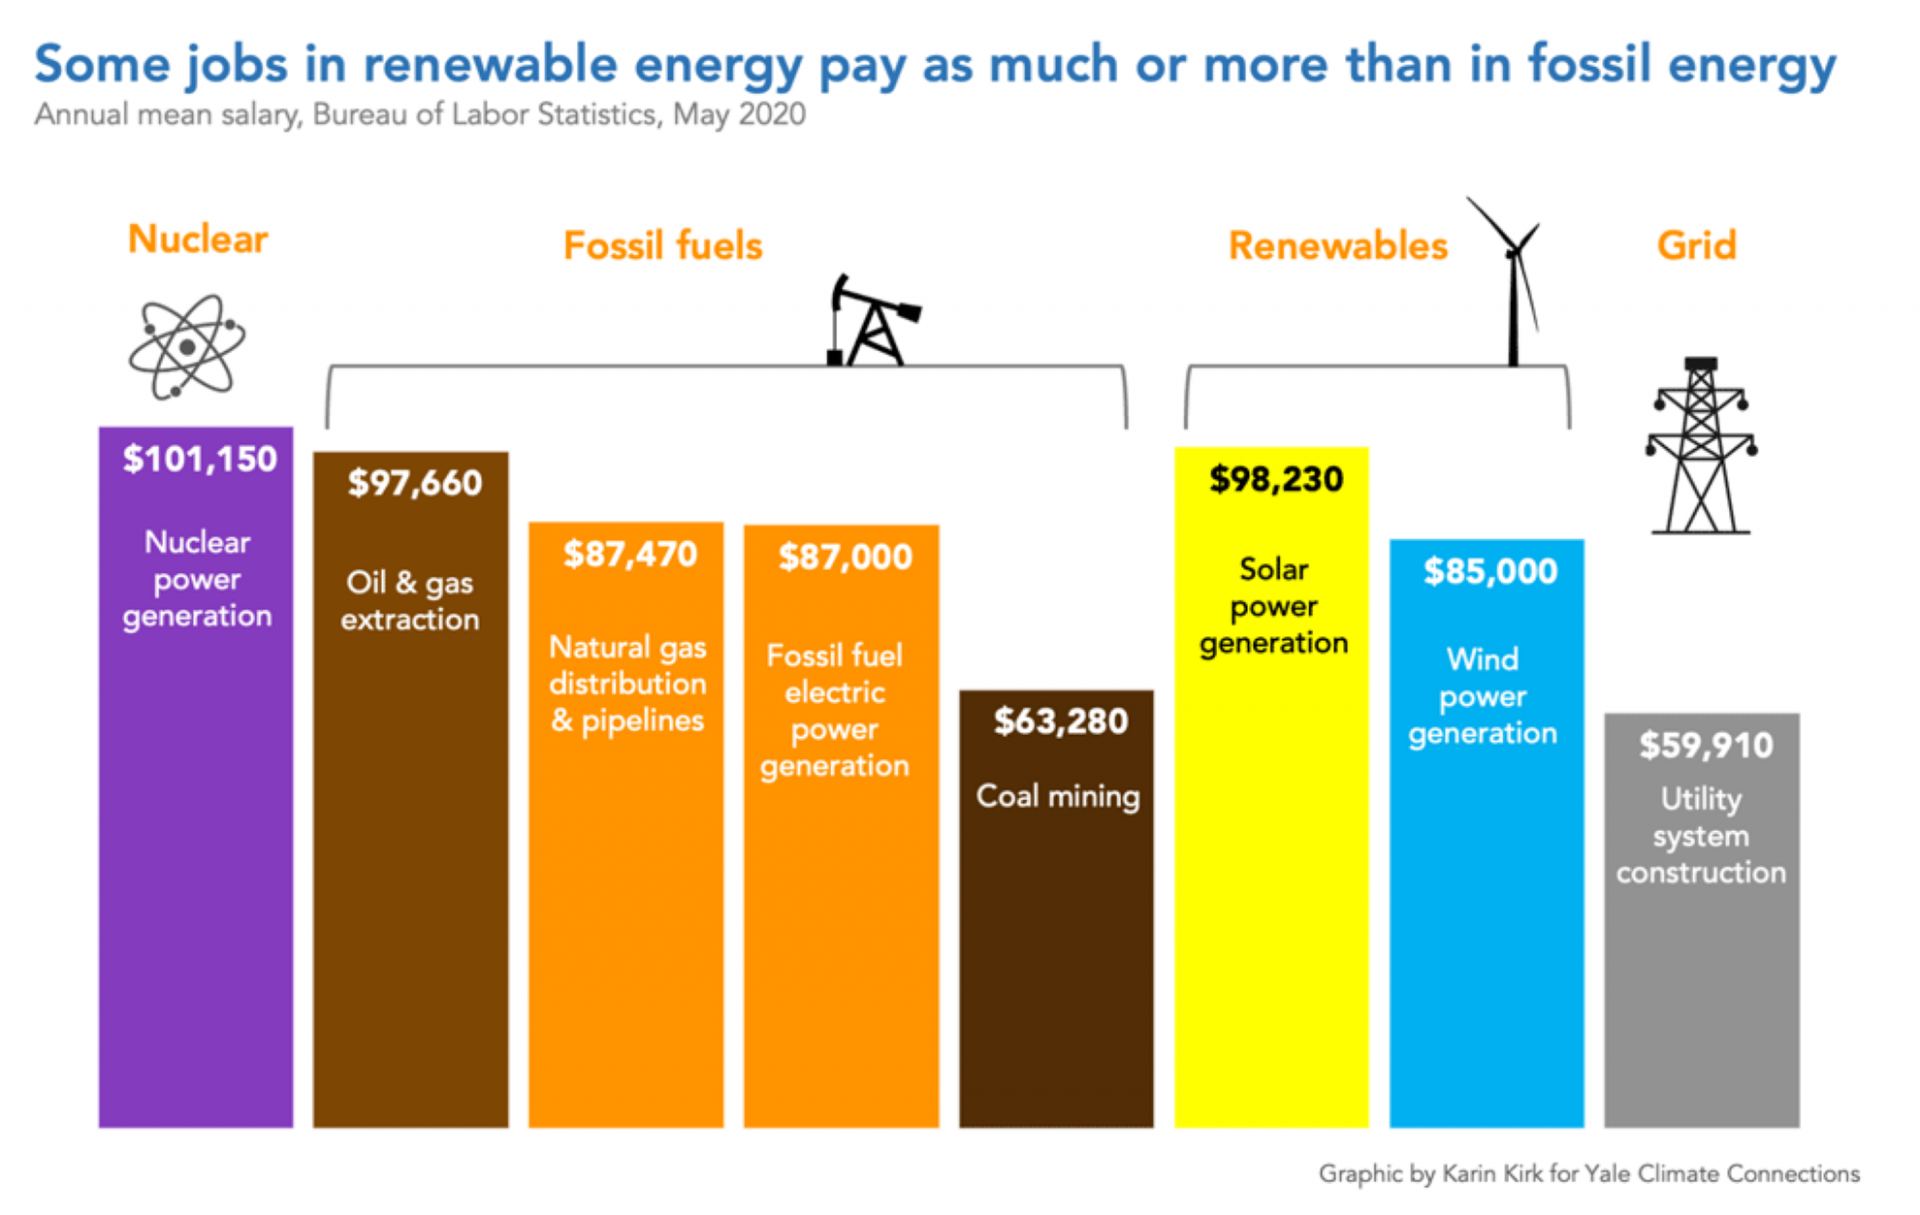
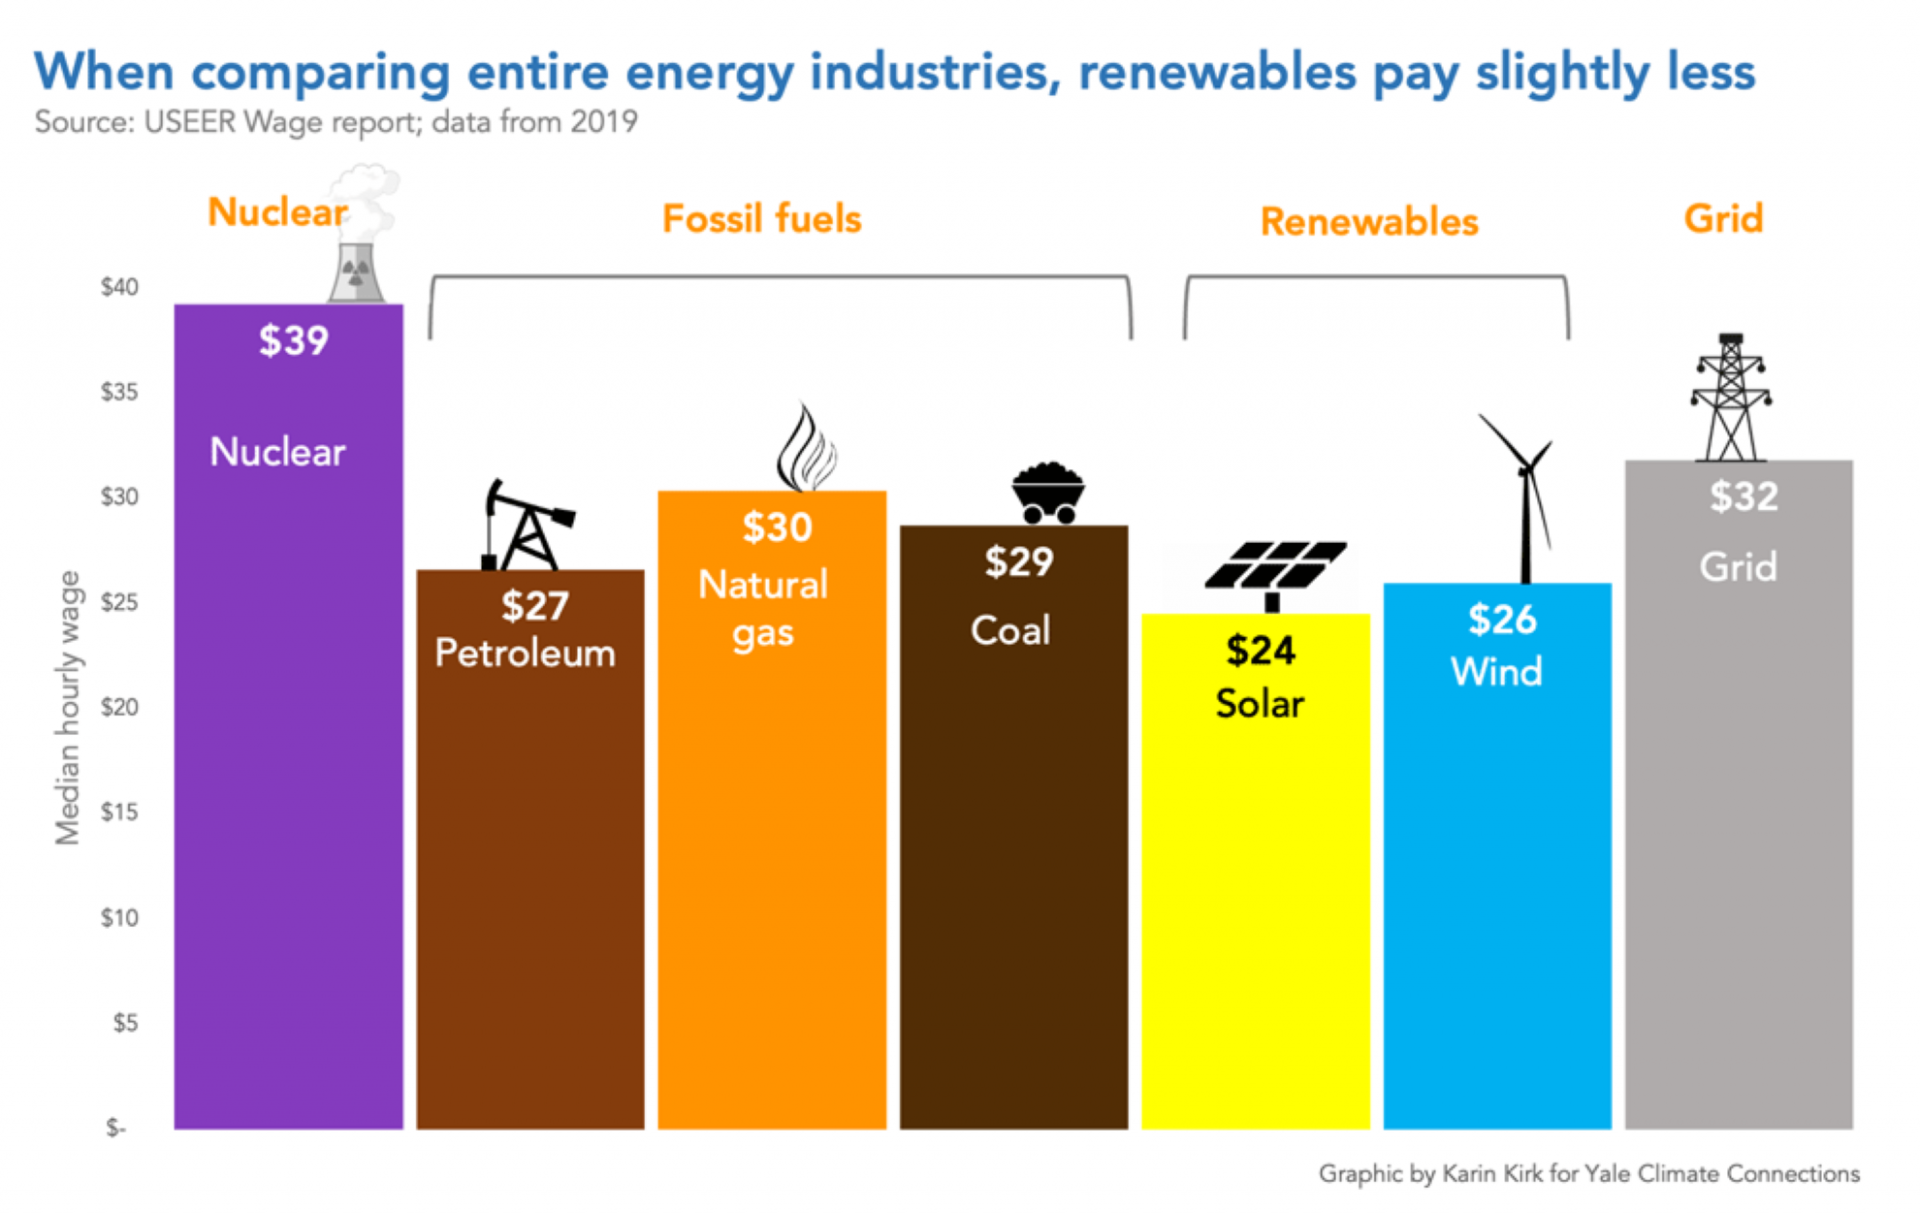
A closer look at energy wages
The 2020 U.S. Energy and Employment Report’s supplement on Wages, Benefits, and Change takes a deeper dive into energy wages. The report pulls together different aspects of each energy sector so that entire industries can be analyzed as a whole and compared to each other.
At first the results will seem to contradict the BLS data. The difference is that this tally captures industry-wide wages, in contrast to BLS data that examine only certain slices of each industry. In the industry-wide comparison, fossil fuels offer slightly higher wages than renewables. Taking a deeper look will show where those wage differences come from.
High-paying jobs are an important consideration as energy transitions from one industry to another, and those jobs lead to a frequent rallying cry of those opposed to moving away from a fossil fuel-based energy economy. Regardless of the relatively small differences between sectors, an important point is that all energy jobs pay well above the national average of $19 per hour, and the non-extractive sectors are growing swiftly. The future of extractive industries’ employment is less certain.
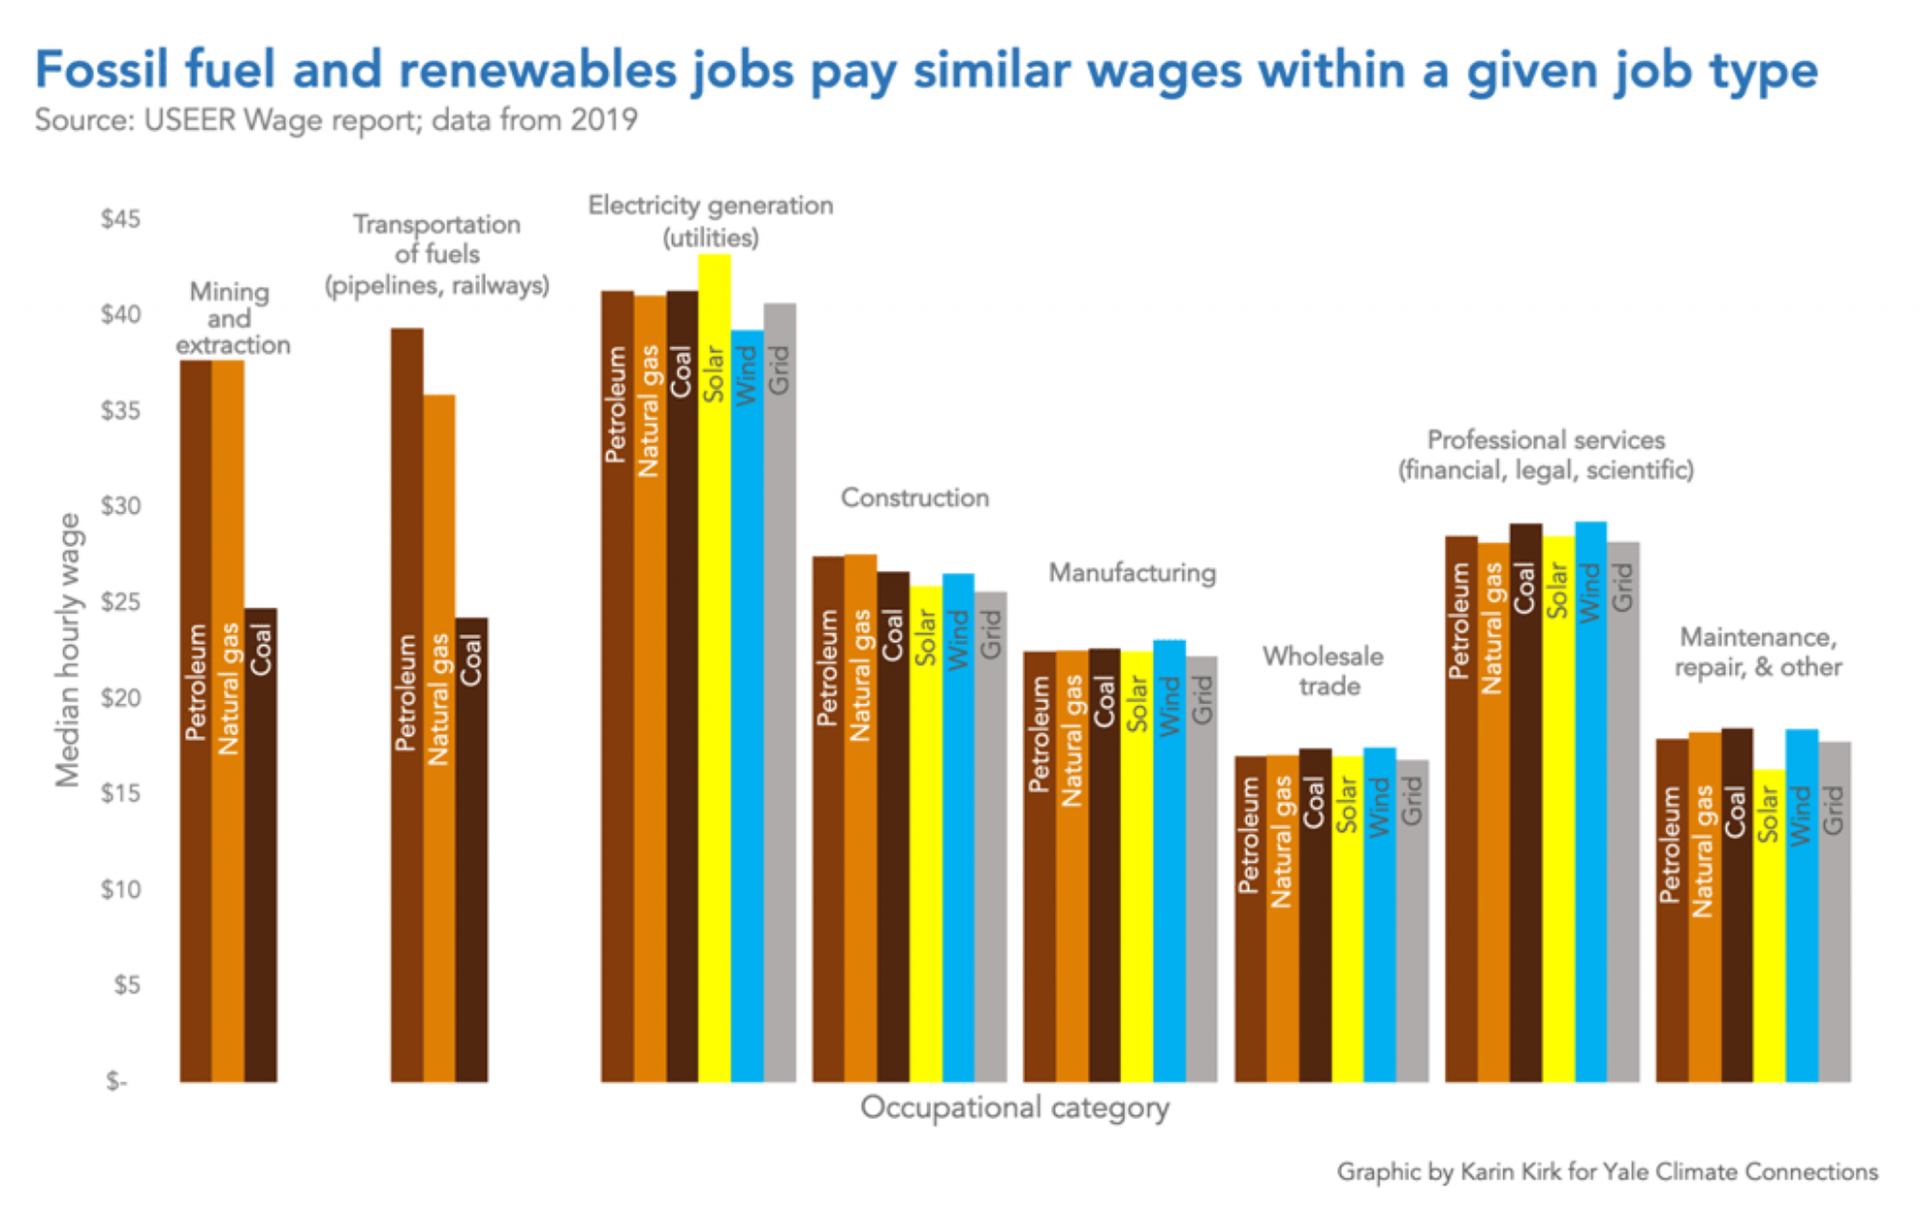
Comparing wage data by job type
The highest wage category in the energy industry is in electricity generation and power plant operations. Regardless of the energy source, the pay is similar between fossil fuels and renewables, with solar electricity generation edging out the others.
The next highest-earning occupations are in mining, extraction, and transportation of oil and gas. These jobs are frequently unionized and are known to offer high pay, high risk, and uncertain stability. But these extraction-based occupations do not exist in the wind or solar energy industries, because no fuel is required to generate electricity from the wind or sun. In other words, there is no analog for mining and drilling jobs: The fossil fuel industry has them. Renewables don’t.
Coal mining stands out in contrast to other extraction jobs, fetching a much lower salary than a comparable job in oil and gas. The low pay may be partly explained by the fact that many coal mines are located in areas with little economic diversity, such as rural West Virginia and Wyoming. Another factor may be that coal companies are facing a starkly shrinking market.
Looking at other occupations, one finds that a given job pays similar wages across each of the energy sectors: Manufacturing jobs tend to offer comparable pay, regardless of which industry is doing the manufacturing. This wage parity applies to construction, trade, professional services, and maintenance.
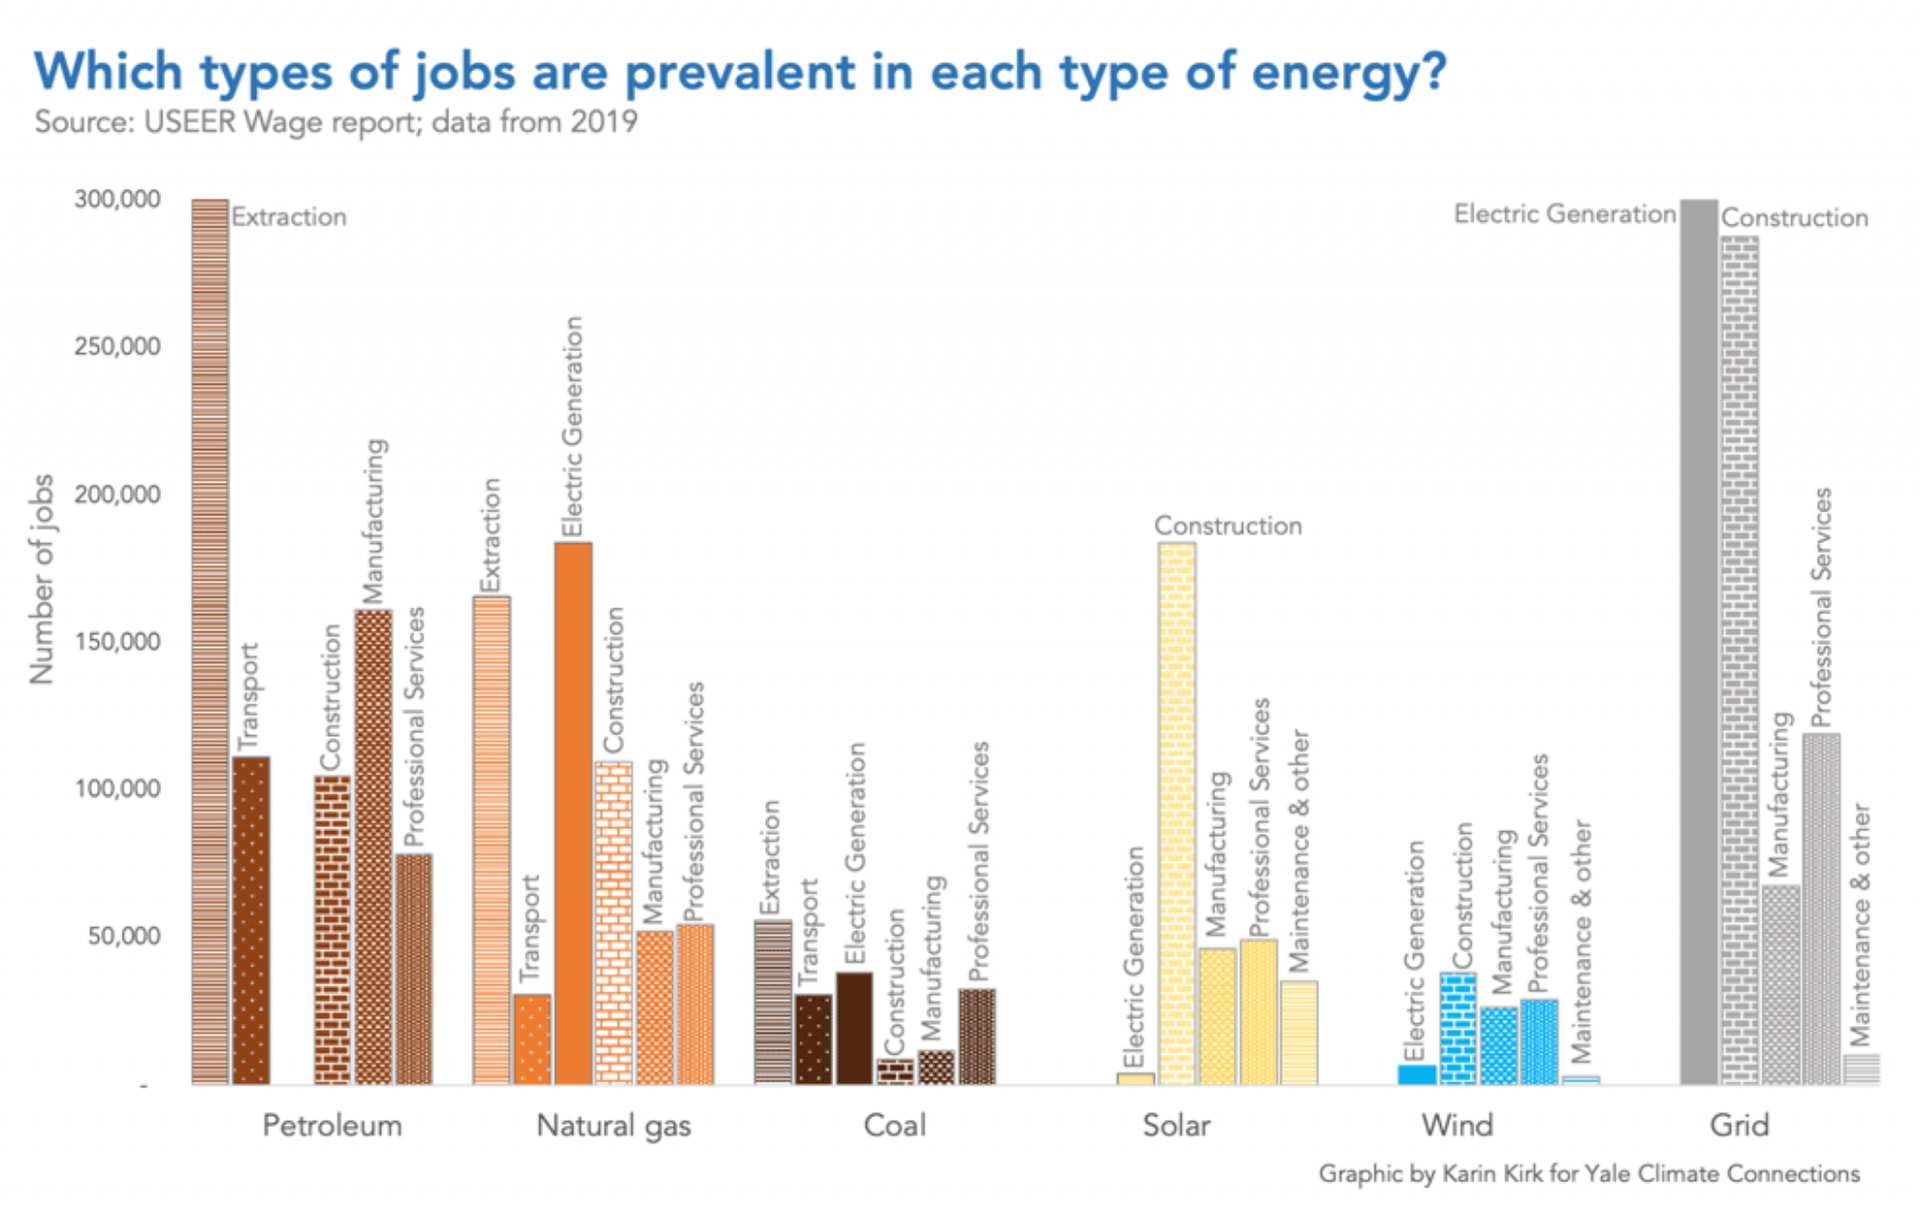
Each industry has a different blend of job types
Another difference between energy sectors is the proportion of people employed within various occupations. In the following comparison, the contrasts between each sector become more apparent. The chart below is complicated, so these bullet points walk through the main takeaways.
- In the petroleum industry, the largest category of employment is in extraction, and there is little work in electricity generation because most petroleum is used for transportation fuels.
- For natural gas, electricity generation edges out extraction in terms of the number of people employed, though both categories are large.
- Extraction is the largest occupation within the coal industry, and it’s important to note that coal employs far fewer people than oil and gas.
- Construction jobs dominate the solar industry, which explains why solar energy, overall, has lower wages compared to fossil fuels. Construction is a lower-paying occupation than oil and gas extraction. That said, solar construction pays more than coal mining and employs far more workers, so that’s one example where a shift toward cleaner energy can replace lower-wage jobs with higher-paying jobs. Lastly, solar construction jobs are numerous – in part because many solar installations are on smaller, residential projects that tend to be labor-intensive.
- Wind industry jobs are led by construction, with professional services and manufacturing close behind. Wind energy is the smallest employment sector in the energy industry, though it’s a reasonable bet that wind will surpass coal in the near future.
- Grid jobs employ over 800,000 people who plan, build, and maintain the nation’s electricity network; this is a massive sector and one that’s frequently overlooked. The bulk of grid jobs are in construction and utilities. A modern grid is an essential element of re-tooling energy systems to accommodate diverse sources of electricity generation, and this sector is expected to grow rapidly. The pending infrastructure bill on Capitol Hill includes a $73 billion investment into the grid.
Boom, bust, and other trends in energy employment
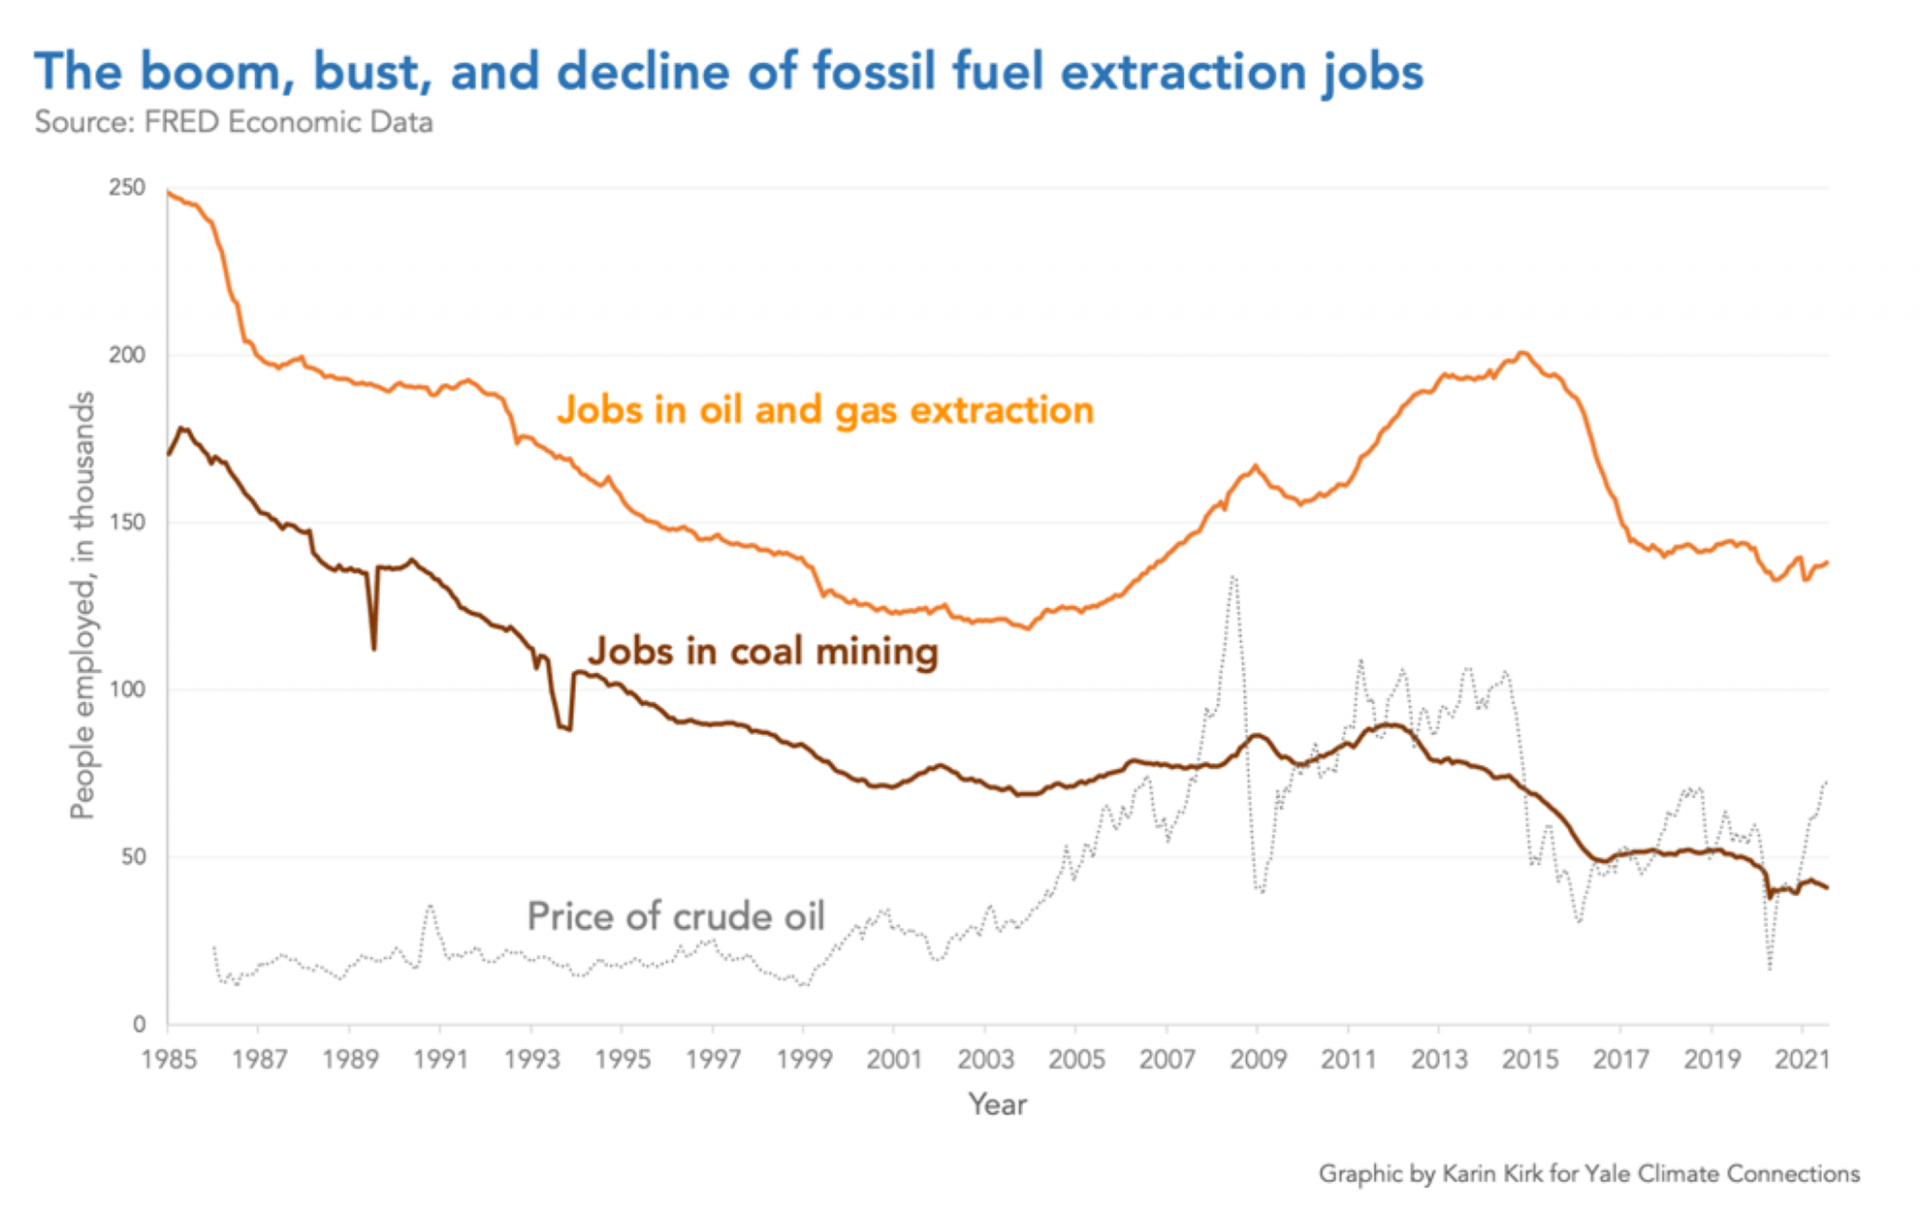
Careers in oil, gas, and coal have traditionally offered high pay but little in the way of job security. The industry is infamous for its cycles of boom and bust, sometimes growing or shedding tens of thousands of jobs in the course of a year or two. The rise and fall of Bakken oil in North Dakota is just one recent example.
One driver of oil and gas employment is the price of oil, and as seen in the graph, ebbs and flows in the value of crude oil foretell losses and gains in the size of the fossil fuel employment pool. The period from 2014 to 2017 offers a vivid case study, as the industry lost 30% of its workforce in the wake of a steep drop in oil prices.
The trend for coal mining jobs is solidly down. Mining has had small upticks but none of the larger bubbles enjoyed by the oil and gas industry. Coal mining has lost over 48,000 jobs since a brief rally in 2011, a decline of 54% in just 10 years.
Renewable jobs gaining ground on fossil fuels
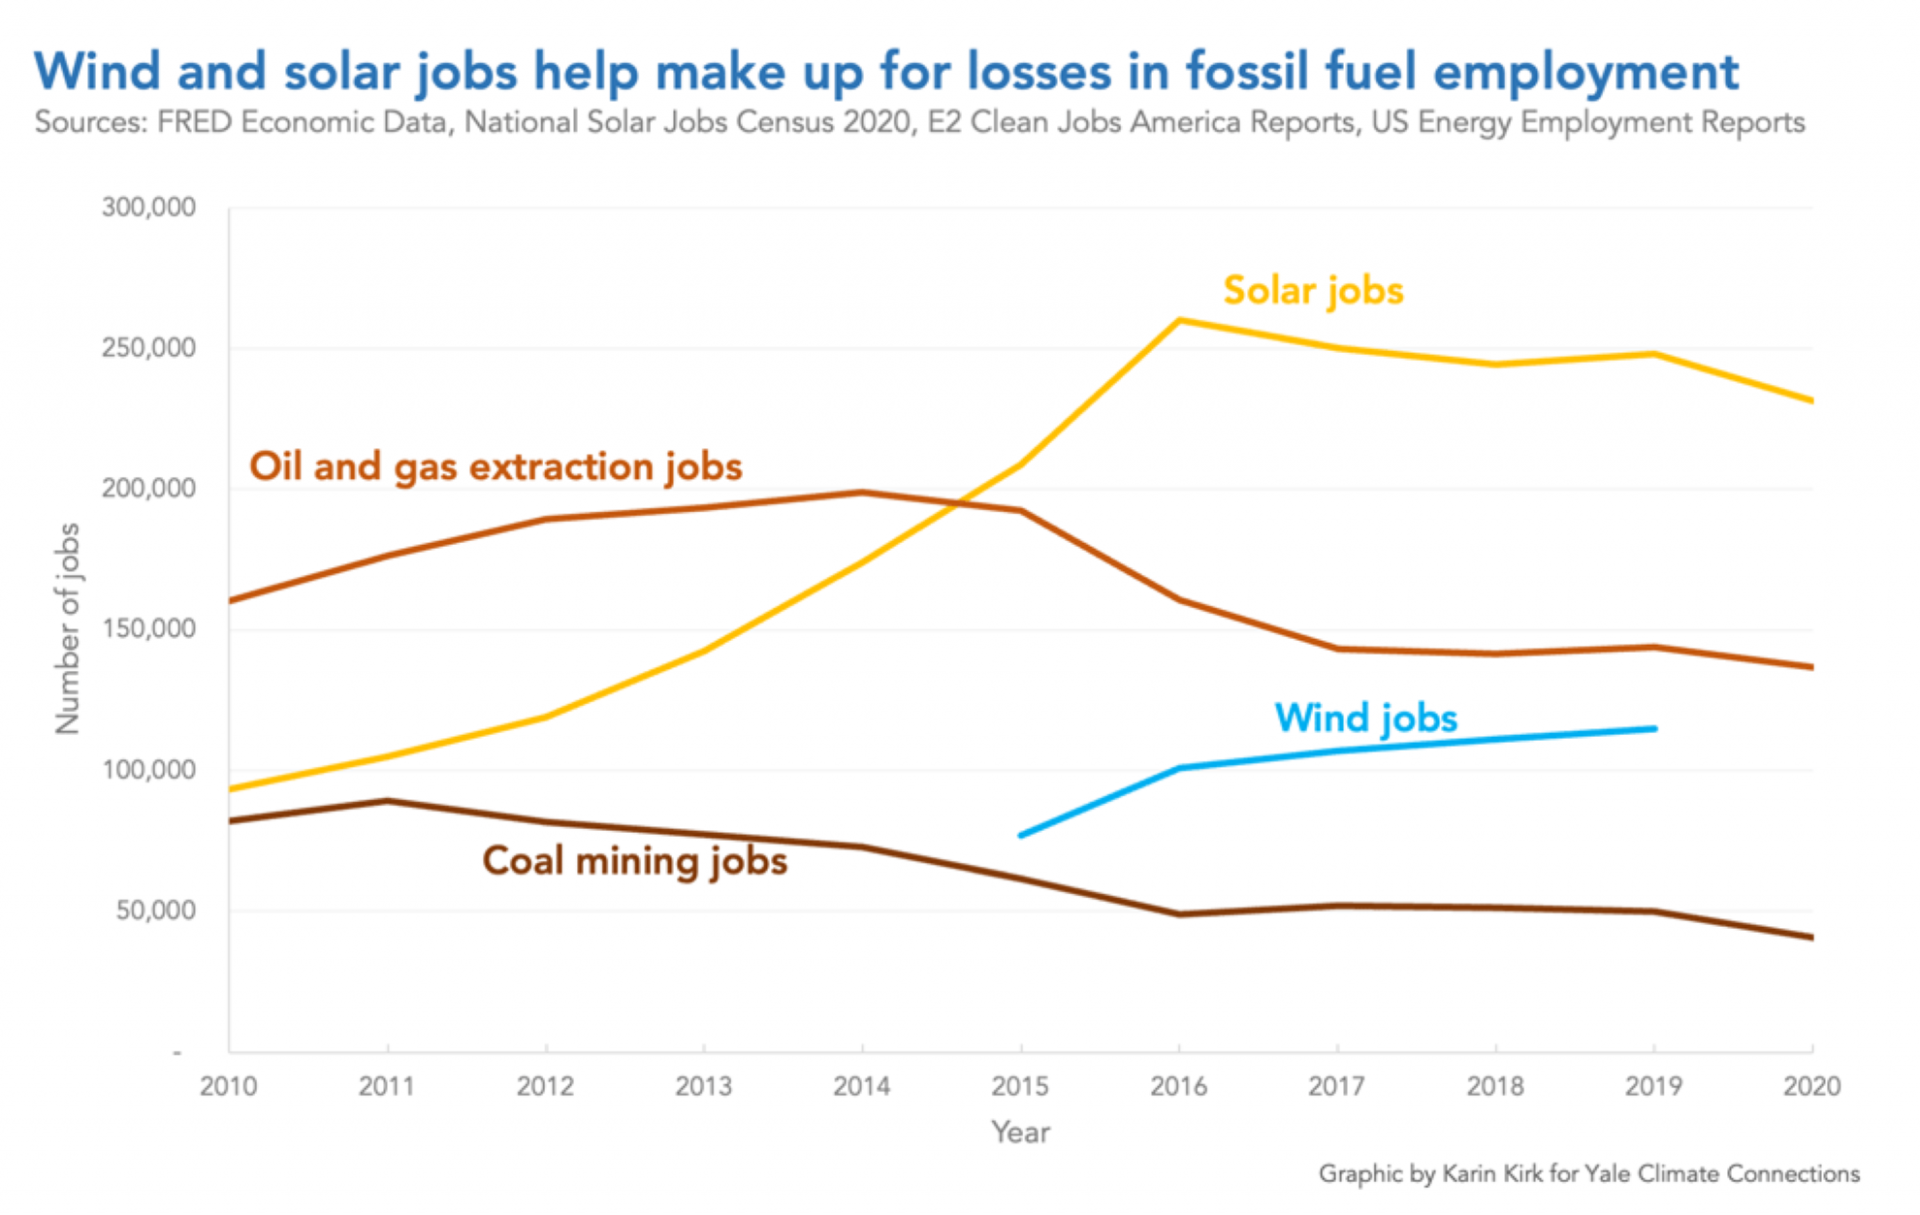
Casting a wider net to look at employment trends between fossil fuels and renewables, the two appear to be heading in opposite directions: Fossil fuel extraction is declining, wind and solar are on the upswing.
Note that the fossil fuel jobs plotted here are only for the extraction side of the industry. These make up the majority of jobs in fossil fuels, but not all of them. That explains why wind jobs appear more numerous than coal jobs in this graphic, but are fewer than coal in a previous graph.
If anything, bouncing back and forth between datasets and ways of comparing the industries shows that care must be taken to accurately wrap one’s head around the employment picture in various energy fields. A superficial talking point may not reflect the realities of the situation.
Solar workforce: More watts per worker
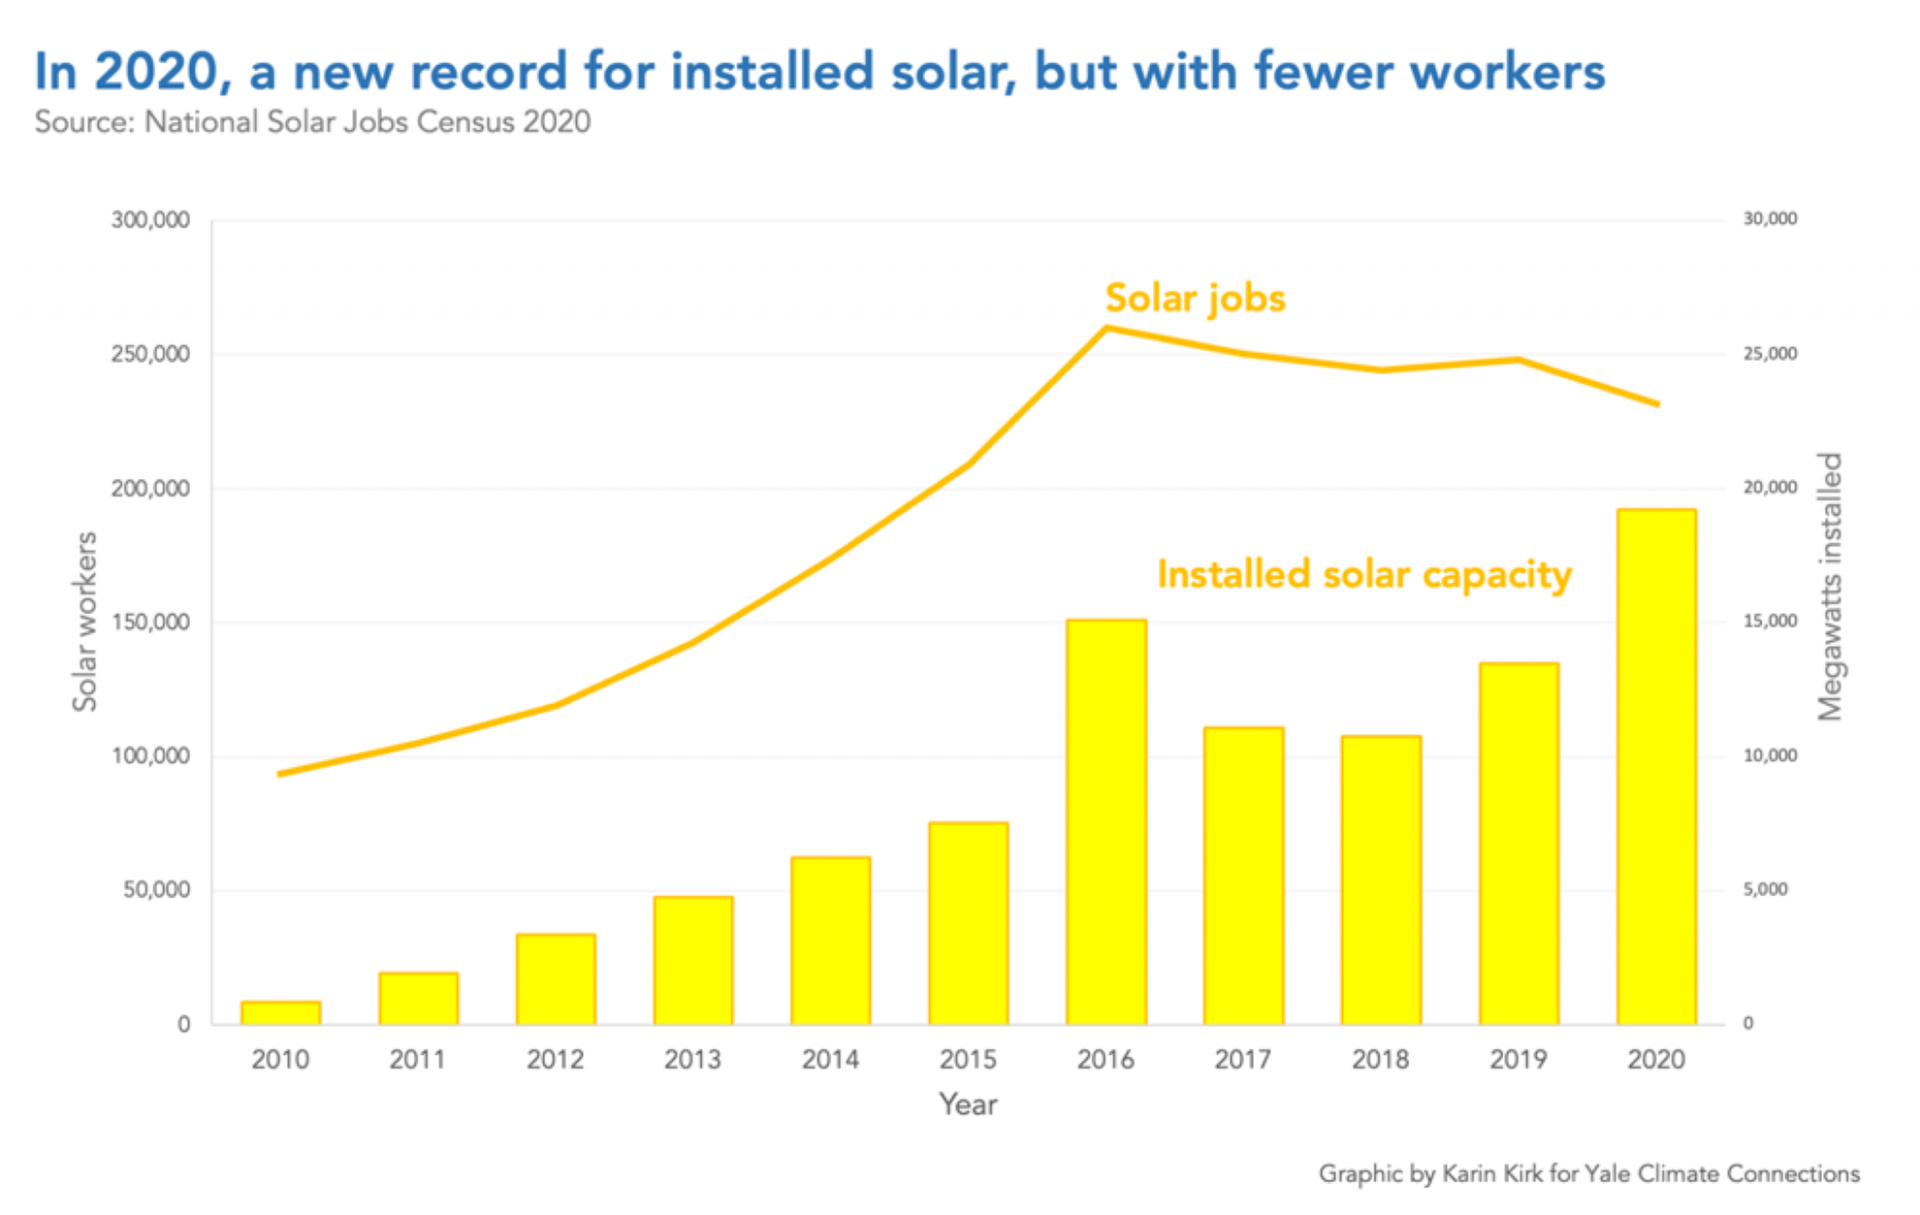
The 2020 Solar Jobs Census report gives a detailed look at solar employment trends over the past 10 years. Jobs in solar energy grew sharply in the first half of the decade, then leveled off. Solar installations grew steadily until 2016, then declined for three years before setting a new high mark in 2020, despite COVID-related shutdowns and slowdowns.
In a counterintuitive turn of events, the solar workforce in 2020 was smaller than in previous years, while the installed capacity of new solar panels was the highest to date. The explanation to this seeming contradiction is that solar projects are getting larger, with a shift toward more utility-scale solar farms in addition to smaller-scale residential systems. A trend toward larger systems means the number of installed panels per worker has increased.
Enormous jobs growth ahead for wind and solar
The growth of wind and solar employment is projected to be somewhere between brisk and explosive, depending on which public policy path the U.S. pursues.
The Bureau of Labor Statistics is projecting 50% growth for solar photovoltaic installers and 60% increase for wind energy technicians by 2029. The Solar Jobs Census is far more bullish, forecasting 150% expansion in the solar workforce over the same time span with current energy policies, and 300% growth if President Biden’s goal of 100% clean electricity by 2030 is enacted into law.
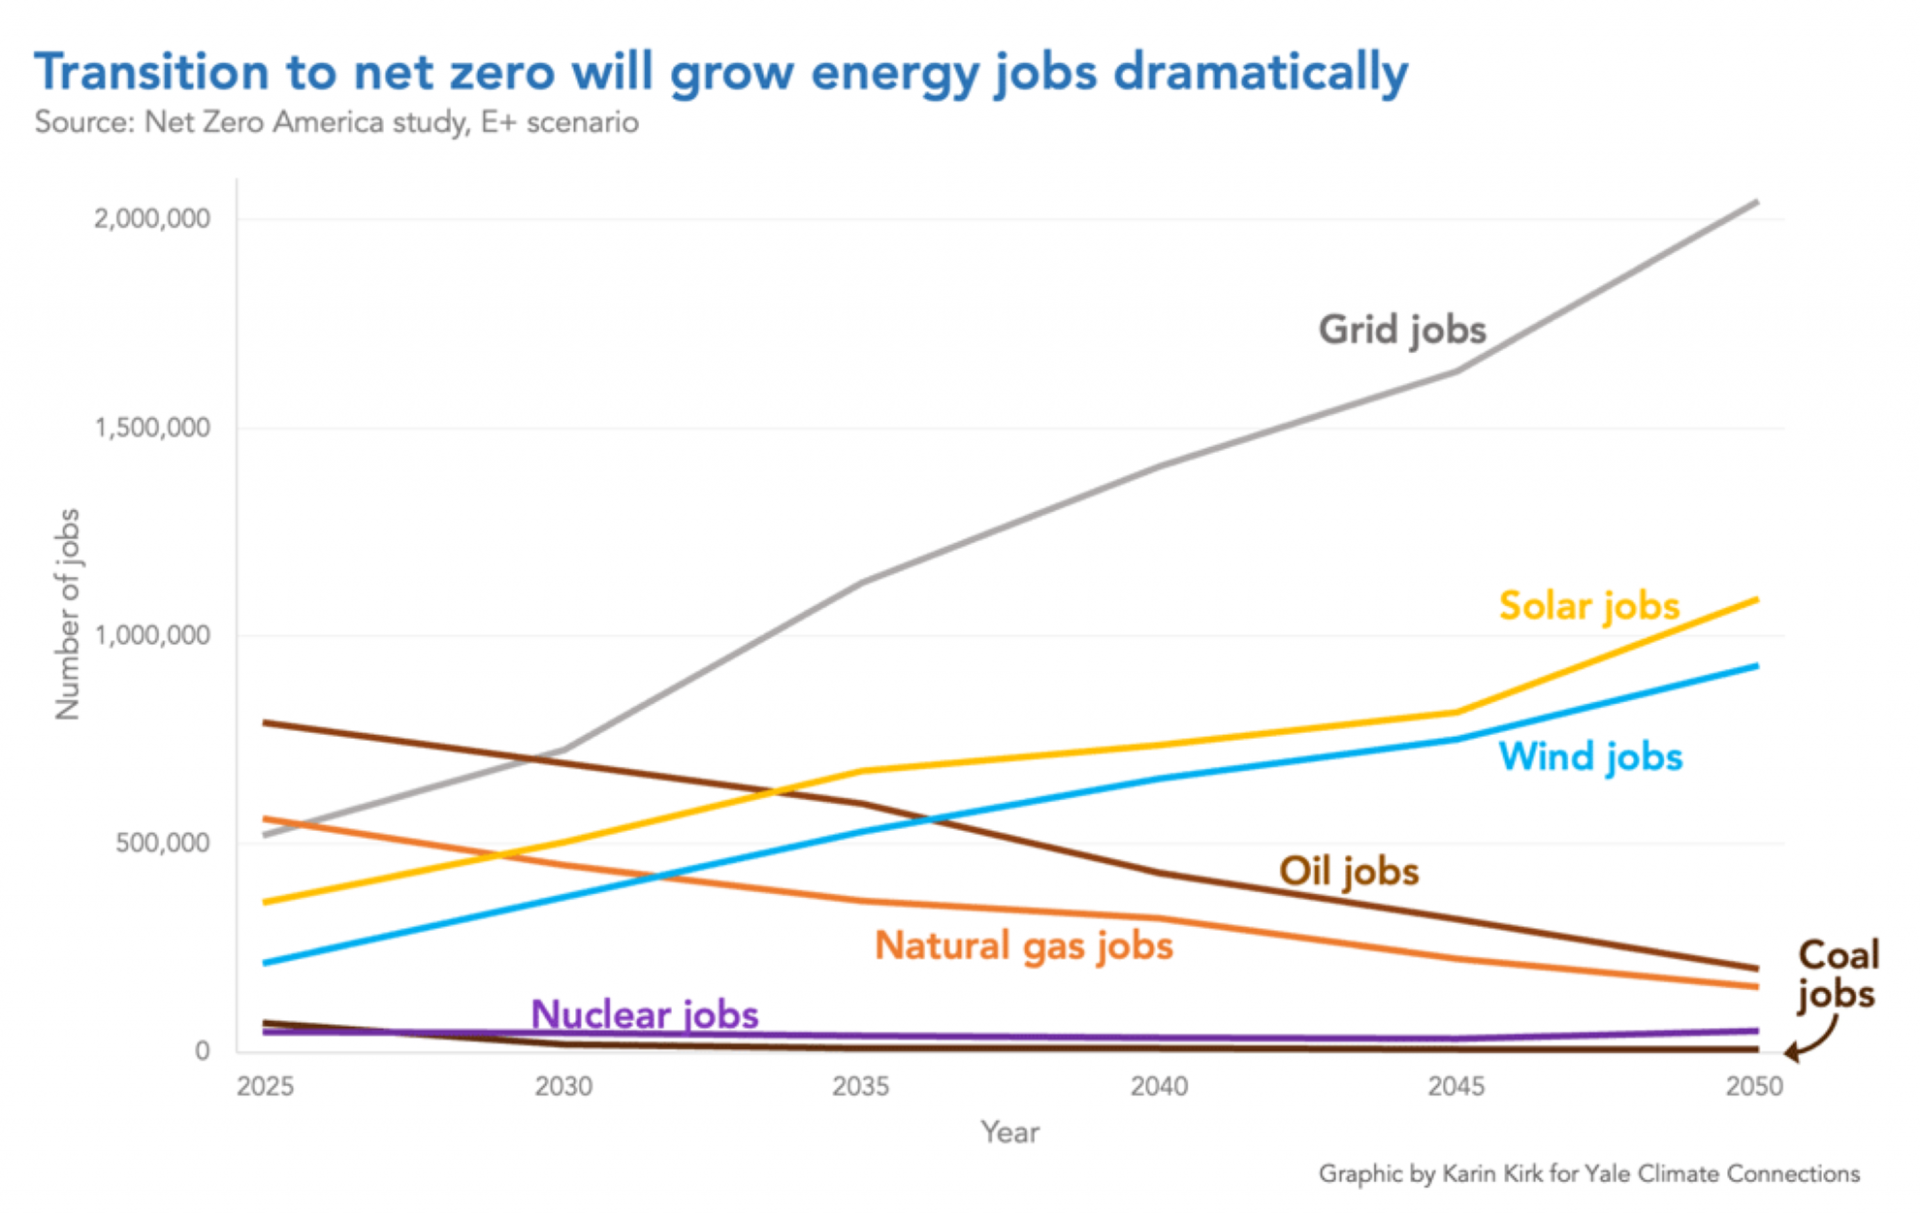
The Net Zero America study, led by Princeton University, forecasts a wholesale reshaping of the energy industry as a result of switching to low- or zero-emissions energy sources over coming decades. The upshot is that energy employment across the country will nearly double, and as the data at the outset of this analysis show, jobs in the energy economy earn well more than others in the general economy. This shift is expected to bring an infusion of high-paying, stable careers to the U.S. job market.
StateImpact Pennsylvania’s Madison Goldberg contributed to this report.
Editor's Picks
PARTNERS


FUNDERS


Climate Solutions partners