
Oklahoma’s Earthquake ‘Swarm’ in One Chart
-
Joe Wertz
EQ Charts
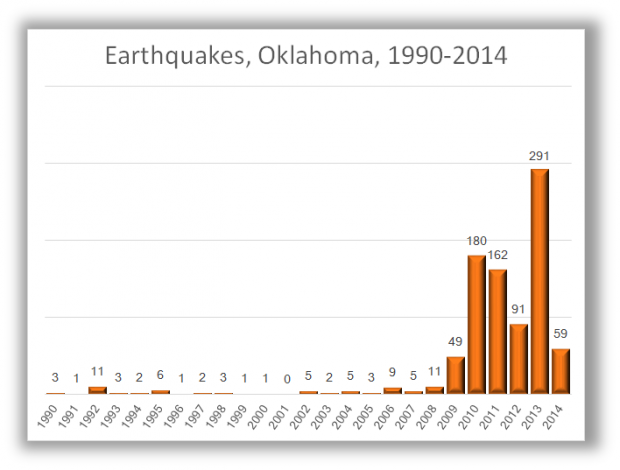
Magnitude 2.0 and greater Oklahoma earthquakes from 1990-2014.
EQ Charts has created a really great visual of Oklahoma’s earthquake “swarm.” The chart was built with data from the U.S. Geological Survey, and shows quakes of 2.0-magnitude or greater.
Most people can feel earthquakes that are 3.0-magnitude or greater. Earthquakes have increased exponentially in Oklahoma, a phenomenon federal and university seismologists have linked to disposal wells used by the oil and gas industry.
The Sooner State has been seismically active historically, but Central Oklahoma’s 2009-2014 earthquake “swarm” is unusual because, as USGS seismologist Bill Leith writes, the quakes don’t seem “to be due to typical, random fluctuations in natural seismicity rates.”