
September 26, 2012 | 10:19 am
Oklahoma’s Workforce in One Chart
-
Joe Wertz

Joe Wertz/StateImpact Oklahoma / Source: Bureau of Labor Statistics
Last week we showed you the composition of Oklahoma’s economy by industry contributions to state domestic product.
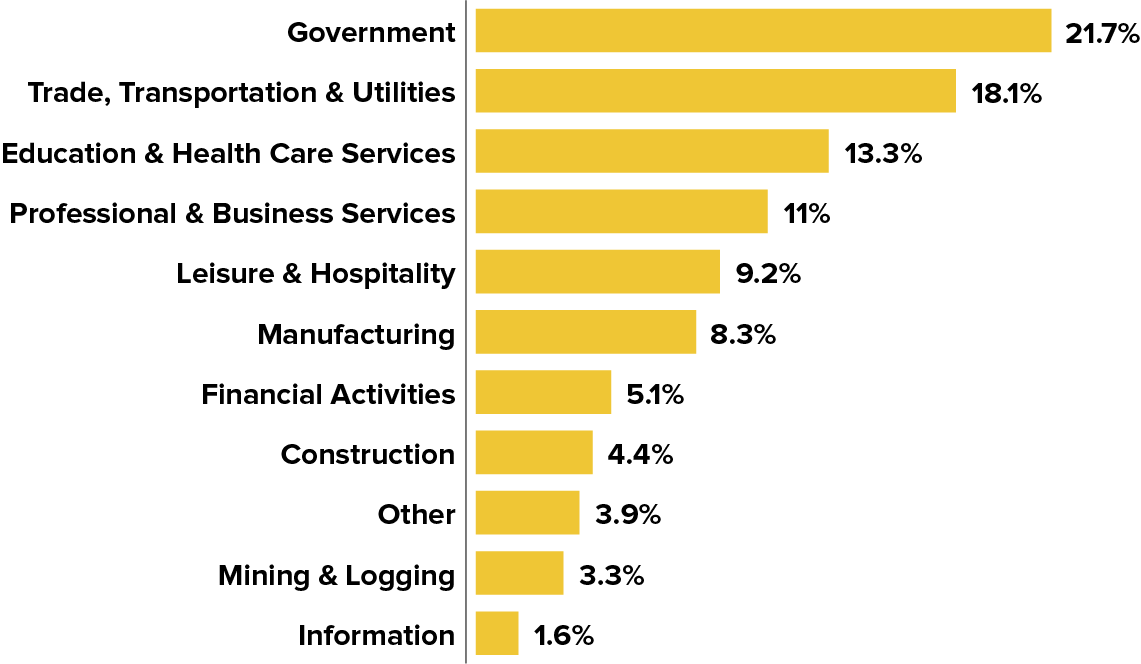
Here’s what Oklahoma’s economy looks like when you break it down by non-farm employment in major industry sectors.
This 2011 data from the U.S. Bureau of Labor Services only reflects Oklahoma’s non-farm payroll, and only accounts for direct employment.
Practically speaking, some of these industries are intertwined. Manufacturing and mining, for example. While only 3.3 percent of Oklahoma’s workforce is employed by mining — which, in Oklahoma, is synonymous with oil and natural gas — that industry has significant ties to manufacturing.
In a report from 2011, economists at the Steven C. Agee Economic Research & Policy Institute examined the economic impact of oil and gas on Oklahoma’s economy.
Using data from 2009, researchers there showed that while direct employment in the oil and gas industry only comprised 3.5 percent — similar to current percentages — of the employed workforce, the energy sector indirectly employed about 300,000, or nearly 20 percent.