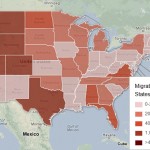
More people moved to Idaho last year than left the Gem State. Still, driver's license data show more than 29,000 gave up their Idaho license in 2012. It's a real-time clue as to where Idahoans are going. We put that information on a map... Continue reading →
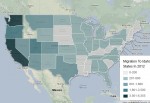
Have you noticed more California drivers on Idaho's roads? Ok, maybe that's feeding an unfair stereotype, but data show more Californians surrendered their driver's license for an Idaho card than any other state last year. It's a clue into who is moving to the Gem State. We put that data on a map... Continue reading →
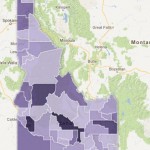
The U.S. Census Bureau has compiled data that looks at the top 5 percent in America, that's defined as households with an annual income of at least $191,469. Through Census' American Community Survey, they compiled data from 2007-2011 to understand which pockets of the country were the wealthiest. We mapped this data in Idaho, county-by-county. Continue reading →
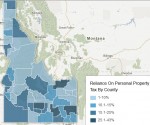
In 2011, more than 53,000 Idaho companies paid the business personal property tax. Half of those businesses paid less than $90. Who stands to benefit from getting rid of the tax? Click around the map to see the top five payers in each county. The darker a county is shaded, the more reliant it is on the personal property tax. Continue reading →
2012 was a good year, comparatively, for Idaho’s housing market.
RealtyTrac’s year-end foreclosure report was released this morning, and it shows Idaho’s foreclosure rate and rank among states continue to drop. The Gem State now ranks 14th, bumping Idaho out of the top 10 in the annual ranking for the first time in years. Continue Reading →
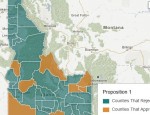
Voters sent a clear message to Idaho lawmakers this week by rejecting all three education propositions by margins of 15 percent or more. See how each county voted and compare that to support for Tom Luna's 2010 reelection bid. Continue reading →
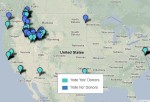
The campaigns for and against Idaho's Propositions 1, 2, 3 have brought in a lot of money. When you add it all up, the two sides have received donations totaling $4.88 million. It's all focused on a months-long tug-of-war over whether the package of controversial education laws known as Students Come First will be upheld or repealed on November 6. Continue reading →

Idaho has fewer doctors for every 100,000 people than every state in the nation except one - Mississippi.
Ever since the Association of American Medical Colleges has been compiling this info, Idaho has ranked at the bottom of the list.
Explore the data. Click around the map to see how Idaho compares to other states. Continue reading →
Sometimes, in reporting, you stumble across something that is just plain great. Lately I’ve been focused on wind development, and this wind map is one of those awesome things I happened to find. Go ahead: click on it. You’ll see.
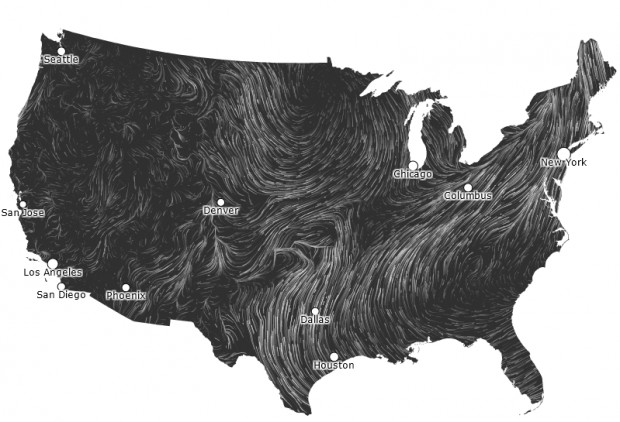
Martin Wattenberg and Fernanda Viegas
The live wind map is an art project, as the site explains. It’s based on data from the National Digital Forecast Database, and it’s updated hourly.
My recent reporting has given me an excuse talk to landowners and lawyers and utility reps and folks at the Idaho Public Utility Commission. Those are fascinating conversations, but it’s complex stuff. That is to say: this mesmerizing, real-time representation of winds blowing all across the U.S. came as a breath of fresh air. Pun intended. Couldn’t resist.
Courtesy: Northwest Power and Conservation Council
 Most of us don’t think about where the electricity that powers our lights, televisions, computers, phones — our lives — comes from. And if we wanted to find out, how many of us would know where to start?
Search no more. Thanks to the Northwest Power and Conservation Council, there’s a map for that. Continue Reading →


