Towanda By The Numbers
StateImpact Pennsylvania’s latest project, BoomTown, documents how natural gas drilling has affected Towanda, Bradford County. Click here to watch and listen to the report.
_____
The Figures Behind BoomTown
Bradford County’s natural gas drilling boom began in earnest in 2008, and has grown exponentially every year, until now.
Explore the facts and figures to see who is–and isn’t–reaping the benefits in Towanda Borough, Bradford County and the surrounding state of Pennsylvania.
Figures shown reflect the first year that new wells appear in DEP data.
The Economy
BUSINESS ESTABLISHMENTS IN TOWANDA
2005: 247
2006: 256
2007: 251
2008: 262
2009: 274
2010: 279
Source: U.S. Census Bureau
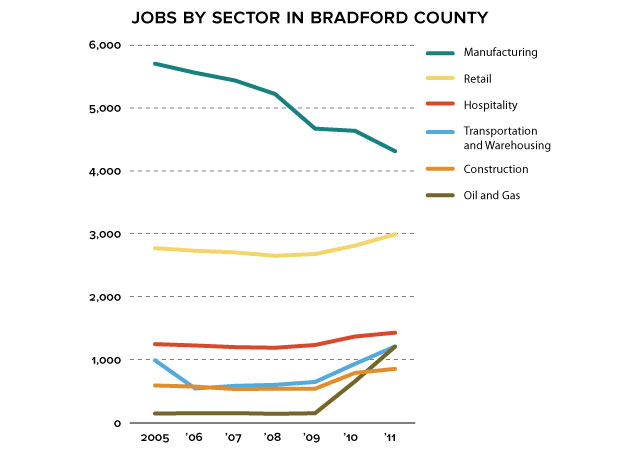
The above chart shows six sectors among 19 sectors from the Pennsylvania Department of Labor & Industry dataset.
Crime in Bradford County
- The criminal caseload increased by 40 percent from 2009 to 2011.
- Bradford County Correctional Center Commitments:
2008: 895
2009: 1,002
2010: 1,065
2011: 1,173
Source: Bradford County District Attorney’s exhibit presented to the Pennsylvania State Senate Law and Justice Committee, June 7, 2012
Towanda’s Traffic Problem
- The average number of trucks driving along U.S. Highway 6, north of Towanda, each day increased 134 percent from 2007 to 2010, from 634 trucks per day to 1,482.
- The number of automobile crashes increased by 25 percent between 2007 and 2010, and 152 percent more of those crashes included “heavy trucks.”
Source: Pennsylvania Department of Transportation


