Background
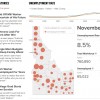
Idaho’s unemployment rate continued to go up after the recession was officially declared over in 2009. The monthly jobless rate didn’t start to trend down until recently, and it’s an economic indicator we’ve followed closely over the last few months. Our coverage is driven in two ways: data and the personal stories. This web-based data application combines both.
Our app will let you visualize Idaho’s unemployment rate over time, and in each Idaho county. You can use the map to get specific data for the county you live in. Then, you can use the slider tool to see how the rate has changed in your area overtime compared with the state and national data.
On the left-hand side of the app you’ll find the personal stories we’ve been reporting for the last few months. The series is called Jobless in Idaho. There, you’ll find the compelling stories of people who found themselves out of work and in many cases, with few options. It’s a series of stories we’re updating regularly as each of the people involved find their next opportunity.


