
May 24, 2012 | 4:17 pm
What the World Wants from Oklahoma and Who Wants It
-
Joe Wertz

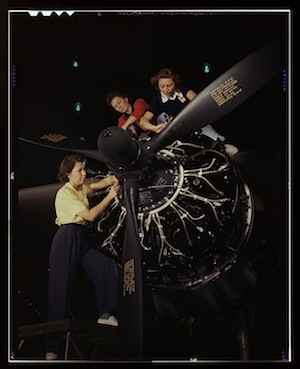
Alfred T. Palmer / Library of Congress
Aerospace is a big deal in Oklahoma, a point illustrated by census data that lists the state’s top foreign exports.
Oklahoma exported $319 million in civilian aircraft, engines and parts in 2011 — the state’s No. 1 foreign commodity export.
Much of the top 10 list relates to the energy industry — parts for pumps, machinery for boring, etc. — but some of Oklahoma’s other top exports surprised us.
Also interesting, the foreign countries that buy most of Oklahoma’s exports.
Exports of of automatic data processing storage units has exploded, data show. Oklahoma exported $38 million worth in 2010. A year later, that total ballooned to $135 million.
Like us, you’re probably wondering: What’s an automatic data processing storage unit?
“Those are CPUs … computer parts,” says Dustin Pyeatt at the state Department of Commerce.
Top Foreign Exports from Oklahoma 2011
| Rank | Export | $ Value | % of Total | % Change ’10-’11 |
|---|---|---|---|---|
| 1. | Civilian aircraft, engines and parts | $319,000,000 | 5.1% | -3.1% |
| 2. | Medical, surgical, dental and veterinary instruments and appliances | $195,000,000 | 3.1% | 17.7% |
| 3. | Swine meat | $154,000,000 | 2.5% | 14.5% |
| 4. | Parts of pumps for liquids | $143,000,000 | 2.3% | 19.3% |
| 5. | Electric conductors for voltage exceeding 1000 volts | $140,000,000 | 2.3% | 23.3% |
| 6 | Automatic data processing storage units | $135,000,000 | 2.2% | 258.9% |
| 7 | Parts for boring or sinking machinery | $112,000,000 | 1.8% | -20.1% |
| 8. | Cotton, not carded or combed | $111,000,000 | 1.8% | -11.2% |
| 9. | Car tires | $102,000,000 | 1.6% | -36.5% |
| 10. | Industrial heat exchange units | $93,000,000 | 1.5% | 84.5% |

Abdallahh / Flickr
O, Canada!
And when it comes to exports, Canada is a good friend of Oklahoma’s. The Great White North snapped up more than 30 percent of Oklahoma’s exports last year, more than triple what the state sent Mexico.
Oklahoma’s Top International Importers 2011
| Rank | Country | $ Value | % of Total | % Change ’10-’11 |
|---|---|---|---|---|
| 1. | Canada | $1,940,000,000 | 31.2% | 3.9% |
| 2. | Mexico | $523,000,000 | 8.4% | 23.3% |
| 3. | Japan | $405,000,000 | 6.5% | 16.4% |
| 4. | China | $367,000,000 | 5.9% | 51.1% |
| 5. | Singapore | $169,000,000 | 2.7% | 40.1% |
| 6. | Australia | $168,000,000 | 2.7% | 50.1% |
| 7. | Germany | $157,000,000 | 2.5% | -0.7% |
| 8. | Brazil | $152,000,000 | 2.4% | 70.0% |
| 9. | United Kingdom | $136,000,000 | 2.2% | 17.3% |
| 10. | Colombia | $126,000,000 | 2.0% | 70.7% |