Why Do-It-Yourself Charts Help Students Remember Math Lessons

John O'Connor / StateImpact Florida
Frances B. Tucker Elementary School 5th grade math teacher Yaliesperanza Salazar stands in front of an example of a line plot.
The 5th grade math lesson at Frances S. Tucker Elementary School asked students to do a lot of things.
They were learning how to use a line plot to organize and visualize data.
They had to add fractions to find a total for the amount of cake or glasses of apple juice students consumed.
Then, they had to divide the total to find the average.
Along the way, the students frequently took a peek at charts hanging around the room. Called anchor charts, these diagrams were drawn by students in the other 5th grade class and laid out each of the steps they used to create a line plot.
As Miami-Dade schools have switched to Florida’s Common Core-based math standards anchor charts are an important addition to classrooms, said Michelle White, who directs math instruction for the school district.
“It tells a learning story,” White said. “When you walk in I can look at anchor charts and see what concepts have been covered.”
The charts also help jog student memories as classes try to move through the year’s lessons.
John O'Connor / StateImpact Florida
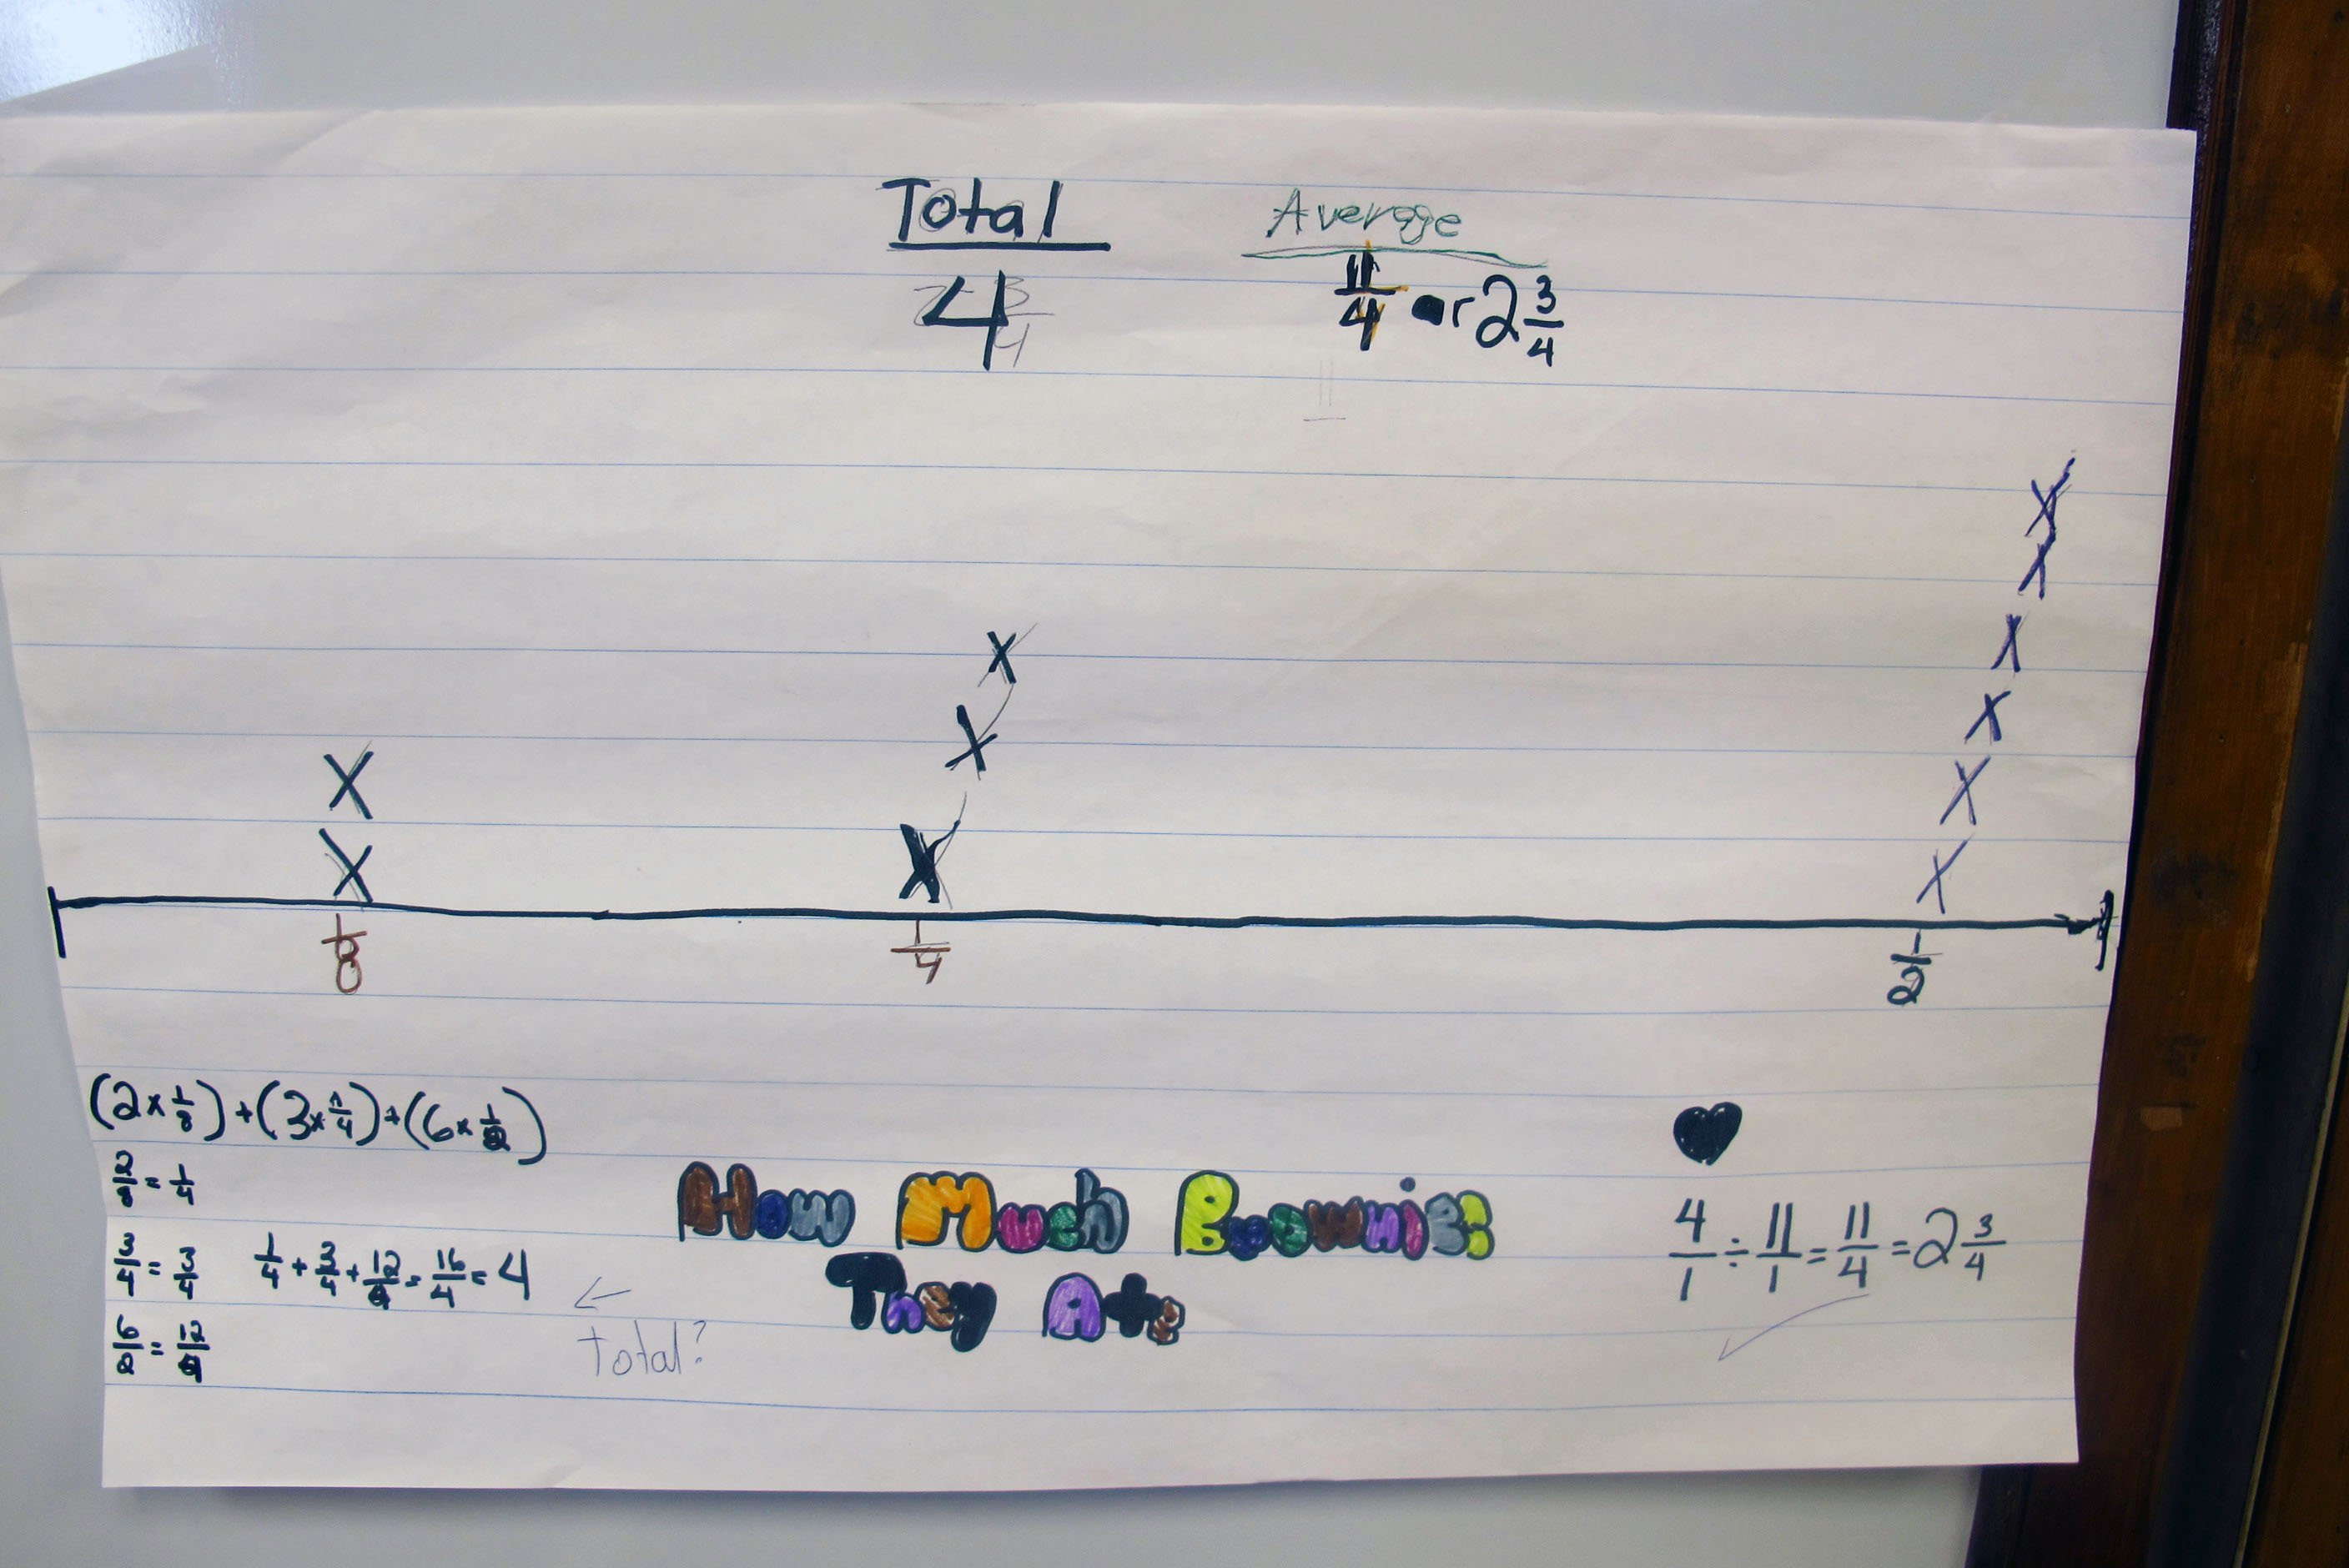
An example of an anchor chart. This one show how many students ate which portion of a brownie.
“You’ll go through and you’ll teach this concept,” White said, “you have to go back and touch back on it, but you don’t get the full lesson again because we’re building on and we’re moving.”
Because students create the charts, White said, they’re proof to students that they can handle the math.
Anchor charts are replacing commercially-produced posters, diagrams and other classroom aides in Miami-Dade schools, White said.
And teachers know the anchor charts work because students want them when it counts most — testing.
“You see the kids looking to where it used to be [on the wall],” White said. “But you have to pull all those things down during testing.”